In modern application development, job queues have become critical infrastructure components. Whether it's sending transactional emails, generating reports, or processing data asynchronously, job queues allow developers to decouple heavy operations from the user experience. Redis, known for its speed and versatility, is a widely adopted backend for such systems. When Redis is used as the engine for task queues, observability becomes crucial. This is where a BullMQ Redis proves invaluable. It brings transparency, control, and real-time insights into how your queueing system behaves under the hood.
What is a Redis Queue Dashboard?
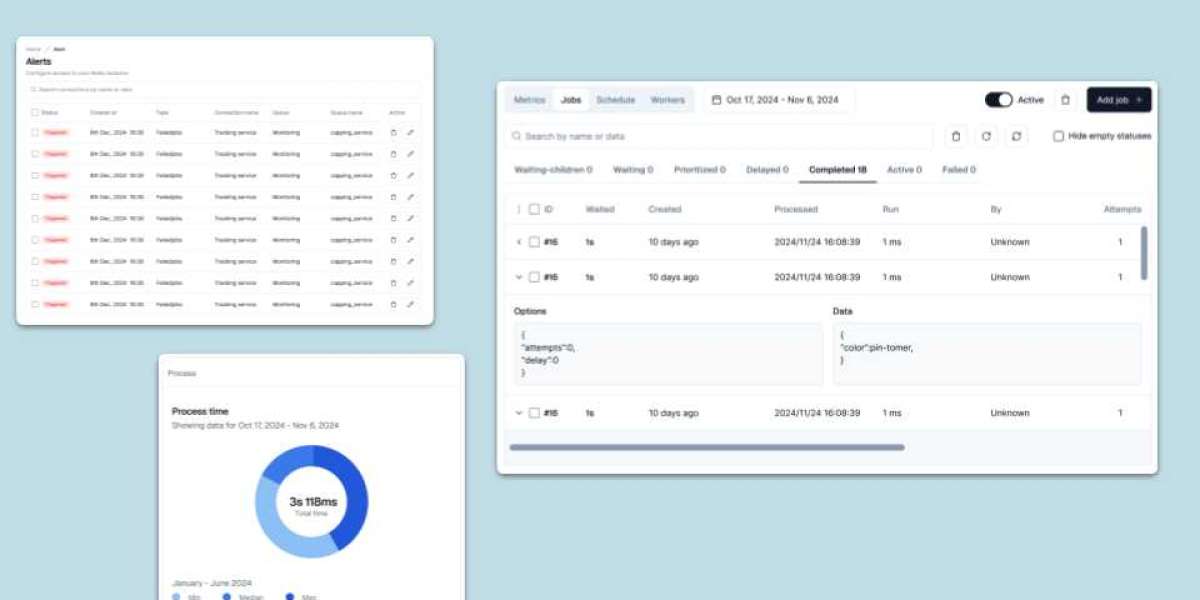
A Redis queue dashboard is a graphical user interface (GUI) designed to monitor, manage, and debug task queues that rely on Redis as their underlying data store. Instead of parsing logs or querying Redis directly, the dashboard presents an organized, real-time snapshot of queues and jobs in various states — including waiting, active, completed, failed, and delayed.
These dashboards are tailored for developers, system administrators, and DevOps teams to understand job flow, diagnose issues, and ensure reliable background processing in production environments. Some popular Redis-based queue systems like Bull, BullMQ, and Kue come with their own compatible dashboards, or integrate seamlessly with third-party tools.
Why a Redis Queue Dashboard is Essential
In production systems where uptime, scalability, and reliability matter, simply enqueuing and processing jobs is not enough. Without visibility, problems can remain hidden until they become critical. A Redis queue dashboard offers multiple benefits:
1. Real-Time Monitoring
A dashboard allows you to see job progression in real-time. Whether jobs are being processed at the expected rate or piling up due to bottlenecks, the dashboard gives instant feedback. This is vital during traffic spikes or deployments.
2. Centralized View of Multiple Queues
Modern applications often maintain multiple queues, each handling different types of jobs (emails, notifications, payments, etc.). A Redis queue dashboard consolidates all this information, allowing teams to manage everything from a single interface.
3. Job State Inspection
Each job goes through several states — from waiting to active, then either completed or failed. Dashboards make it easy to inspect individual job details, view job history, and understand the cause of failures through error logs and stack traces.
4. Manual Control and Intervention
Sometimes, automated systems need human intervention. A Redis queue dashboard enables manual actions such as retrying failed jobs, removing redundant ones, or promoting delayed jobs for immediate execution — all without touching the Redis CLI or writing scripts.
5. Performance Metrics
Dashboards often include performance charts and statistics, such as job throughput, average processing time, retry counts, and failure rates. These metrics help teams tune worker performance, scale infrastructure, and improve system resilience.
6. Operational Transparency
For DevOps and support teams, having a visual interface reduces friction. Instead of relying solely on developers to debug job issues, operational teams can use the dashboard to investigate job flow, alert thresholds, and recovery strategies.
Key Features to Look for in a Redis Queue Dashboard
If you're selecting or building a Redis queue dashboard, here are the key capabilities to consider:
Queue Overview: A summary of all queues and their current job statuses (e.g., 120 waiting, 30 active, 5 failed).
Job Detail View: Drill-down capabilities to inspect job data, timestamps, logs, and metadata.
Search Filtering: Tools to search for jobs by ID, type, status, or custom tags.
Time-Based Analytics: Graphs showing historical trends such as daily throughput, peak traffic times, and job latency.
Alerting and Notifications: Integration with alerting systems to flag anomalies like high failure rates or growing backlogs.
Role-Based Access: Controls to restrict dashboard access based on team roles (developers vs. operators).
Common Use Cases for a Redis Queue Dashboard
The utility of a Redis queue dashboard spans a variety of scenarios:
During Deployments: Ensure queues are draining correctly and new jobs are processed after a code release.
During Incidents: Quickly isolate jobs or queues causing errors without manually querying Redis.
During Scaling: Assess whether existing workers can handle the job load or if you need to spin up more instances.
During Audits: Review historical job logs and metadata for compliance and debugging purposes.
Tools That Provide a Redis Queue Dashboard
Several tools and libraries support Redis-backed job systems and offer dashboards for them:
Bull Board / BullMQ UI: Dashboards specifically tailored for Bull and BullMQ queues, offering real-time data, job inspection, and manual job control.
Arena: A dashboard for Kue and Bull queues, supporting multiple Redis connections and a wide array of visual metrics.
Custom Dashboards with Prometheus Grafana: For teams with more specific needs, Redis queue data can be exported into Prometheus and visualized through Grafana dashboards. While not as job-centric, these offer robust analytics and alerting.
Best Practices for Using a Redis Queue Dashboard
To get the most value from your dashboard:
Deploy It Close to Redis: Minimize latency and reduce connection issues by placing the dashboard near your Redis server geographically or within the same network.
Use Secure Authentication: Ensure that only authorized users can access sensitive queue data and control job execution.
Monitor Resource Usage: Dashboards themselves can consume resources, especially when refreshing high-volume job data. Optimize polling intervals and caching strategies.
Integrate with Incident Response: Tie dashboard insights into your monitoring stack to automate escalation and recovery workflows.
Conclusion
A Redis queue dashboard is much more than a convenience — it's a fundamental component for anyone operating high-volume, job-driven applications. By transforming abstract queue data into actionable, visual insights, it empowers teams to build more reliable, transparent, and scalable systems. Whether you're a solo developer managing background tasks or an enterprise team orchestrating thousands of jobs per minute, investing in a Redis queue dashboard ensures you're never in the dark when it comes to your application’s critical background operations.